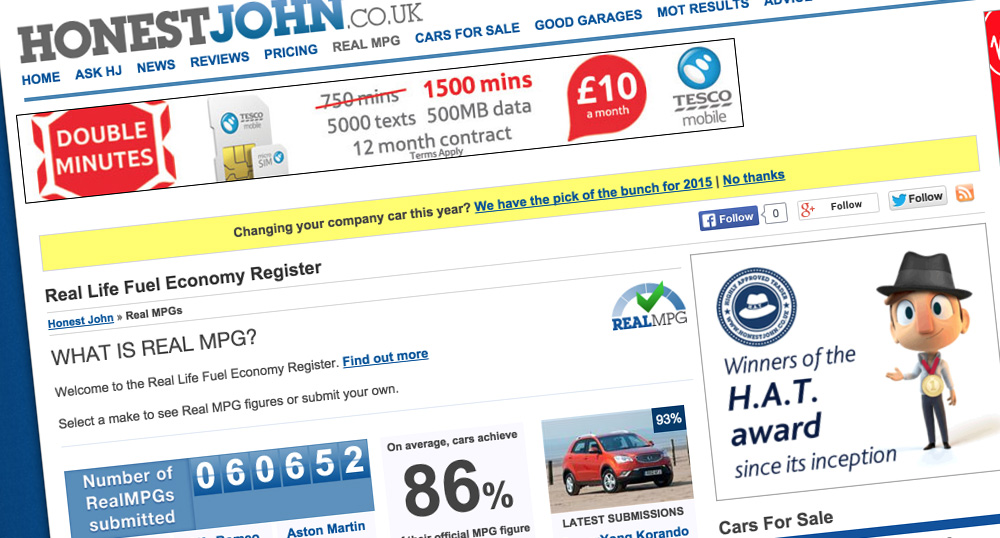
A report by the kind folks at HonestJohn.co.uk has revealed that small cars have shown the greatest shortfall against manufactures official MPG figures.
The report which studied more than 60,000 cars compared “real world” driving figures against those claimed by manufacturers. The revealed that in some cases such as the Nissan Note, averaged a shortfall of 32.3%.
Managing Editor of HonestJohn.co.uk, Daniel Powell said, “It’s no secret that car buyers are confused by official fuel economy figures. Indeed, HonestJohn.co.uk receives thousands of complaints about misleading fuel economy figures, which shows that many car owners are out of pocket when it comes to calculating real world fuel costs.”
The real world MPG figured are recorded using HJ’s Real Life Fuel Economy Register. It allows drivers to both submit and review MPG figures for most major makes and models of cars in the UK. Judging by the results for my own Mercedes C220 CDI BlueEfficiency Automatic, the figures seem about right for general (non Hypermiling) exercises.
It’s great to see services such as RealMPG and TrueMPG highlighting the discrepancies of manufacturer’s claims vs real word fuel efficiency returns. However I’m also keen to point our that the biggest factor in fuel efficiency is the nut behind the wheel. Road, weather and traffic conditions do play a major part but even the most favorable conditions will still not be able to fix a driver with no regard for good fuel efficiency practices i.e. Hypermiling.
Below is a down of the best and worst performers on Honest John’s RealMPG
| Top 5 performing models | Real mpg ratio |
| 1. Land Rover Defender (1984) | 106.30% |
| 2. Toyota Celica (2000-2008) | 103.00% |
| 3. Nissan Micra (2003-2010) | 102.60% |
| 4. Volvo S60 (2000-2008) | 102.30% |
| 5. Volvo V70/XC70 (2000-2007) | 102.20% |
| Bottom 5 performing models | Real mpg ratio |
| 1. Nissan Note (2013) | 67.70% |
| 2. Mini Hatch (2014) | 68.00% |
| 3. Citroen DS5 (2012) | 70.80% |
| 4. Renault Captur (2010) | 70.80% |
| 5. Ford Fiesta (2013) | 70.80% |
[ad]

What I’ve discovered is that you have to try very hard to reach those magic economy figures quoted by their manufactures.
That is the whole point of Hypermiling, discovering the true potential economy of your super efficient Turbo diesel.
Mercedes claim my current car, a Smart ForTwo Cdi can average 85mpg.
That figure can be achieved, but it is by no means easy.
I did squeeze 91mpg from the car once and have obtained better than 85mpg a few times whilst travelling North to Northumberland.
Nobody is saying Hypermiling is easy, or hitting those huge economy figures.
What i am saying, is that with practice and an awful lot of patience most drivers can achieve their cars claimed fuel efficiency figures.
Most owners are under the apprehension that achieving 80mpg+ is easy, It most certainly is not,
BUT WITH PRACTICE IT CAN BE DONE.